Talk to Your Data: CCDS-led Team Wins IEEE PacificVis 2026 Best Paper for Turning Static Charts Into Interactive Ones
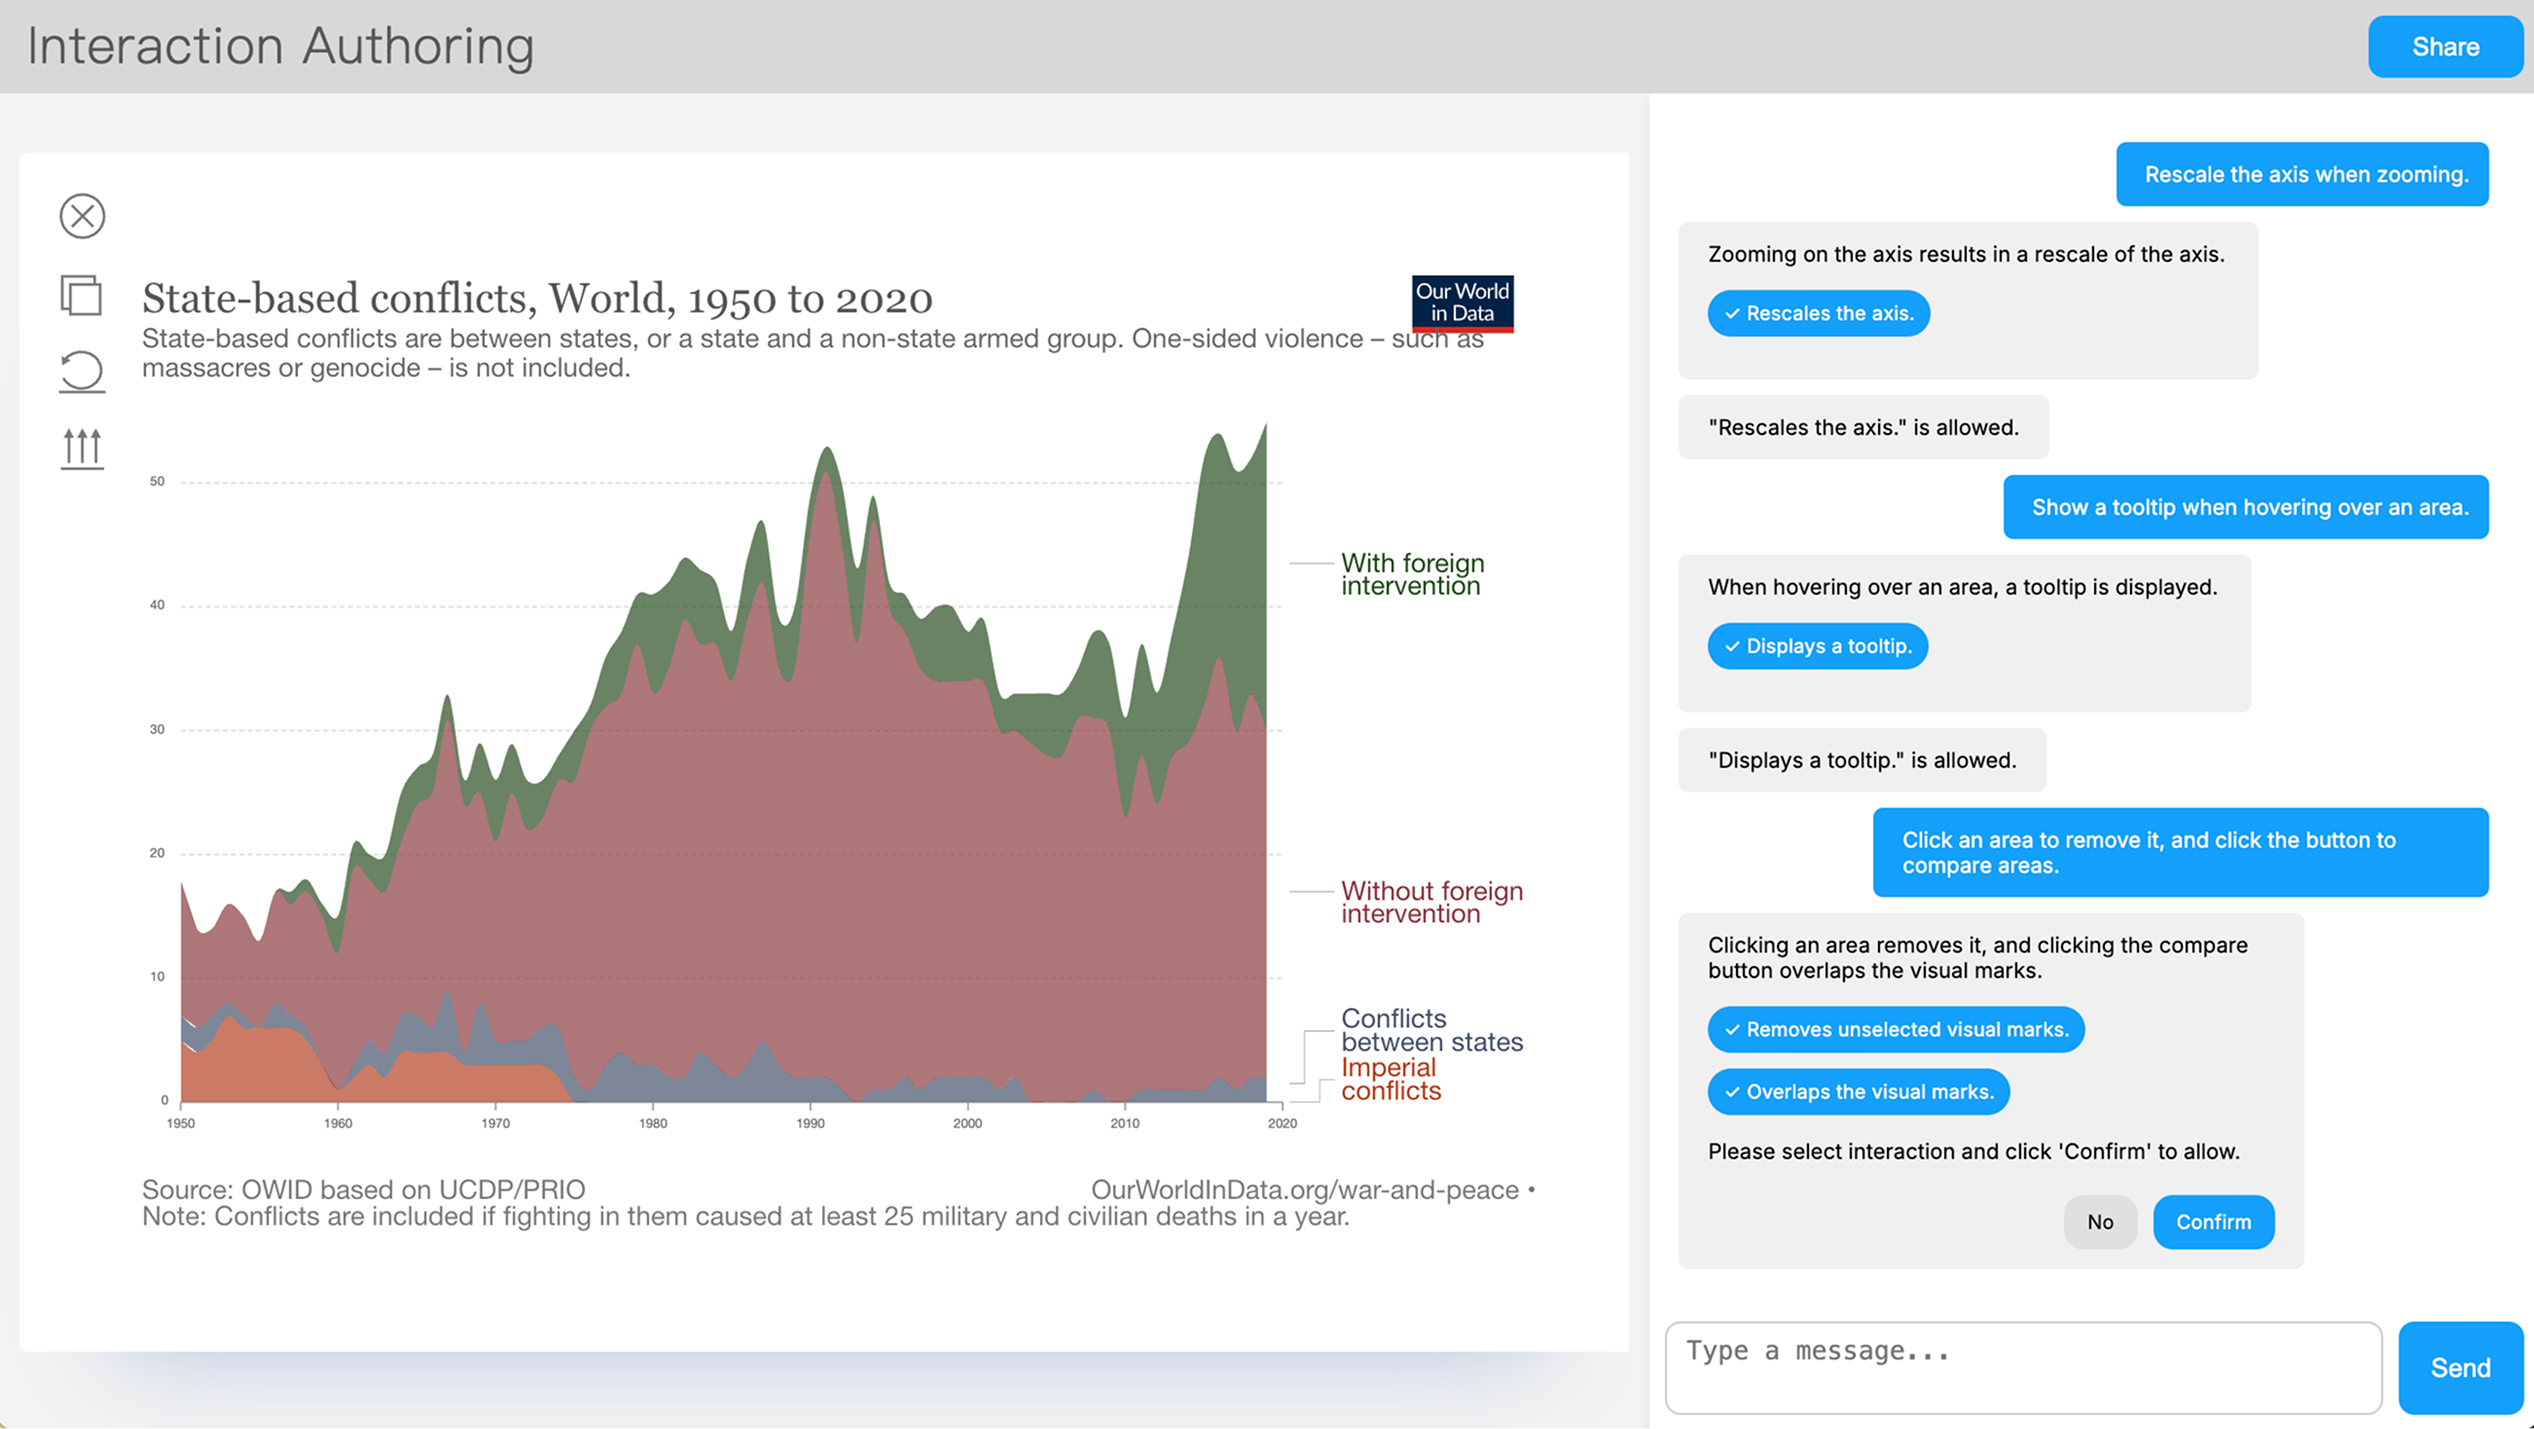
What if you could “talk” to a graph? This is now possible with Athanor, a system developed by an inter-institutional team led by Assistant Professor Wang Yong from the College of Computing and Data Science (CCDS).
Athanor uses multimodal large language models to read a static chart image, understand its visual structure, and add interactive features based on plain English instructions. A user might say "add a tooltip when I hover over a bar" or "let me switch between a line chart and a bar chart". The system interprets the request, works out what the chart is showing, and builds working interactivity on top of it.
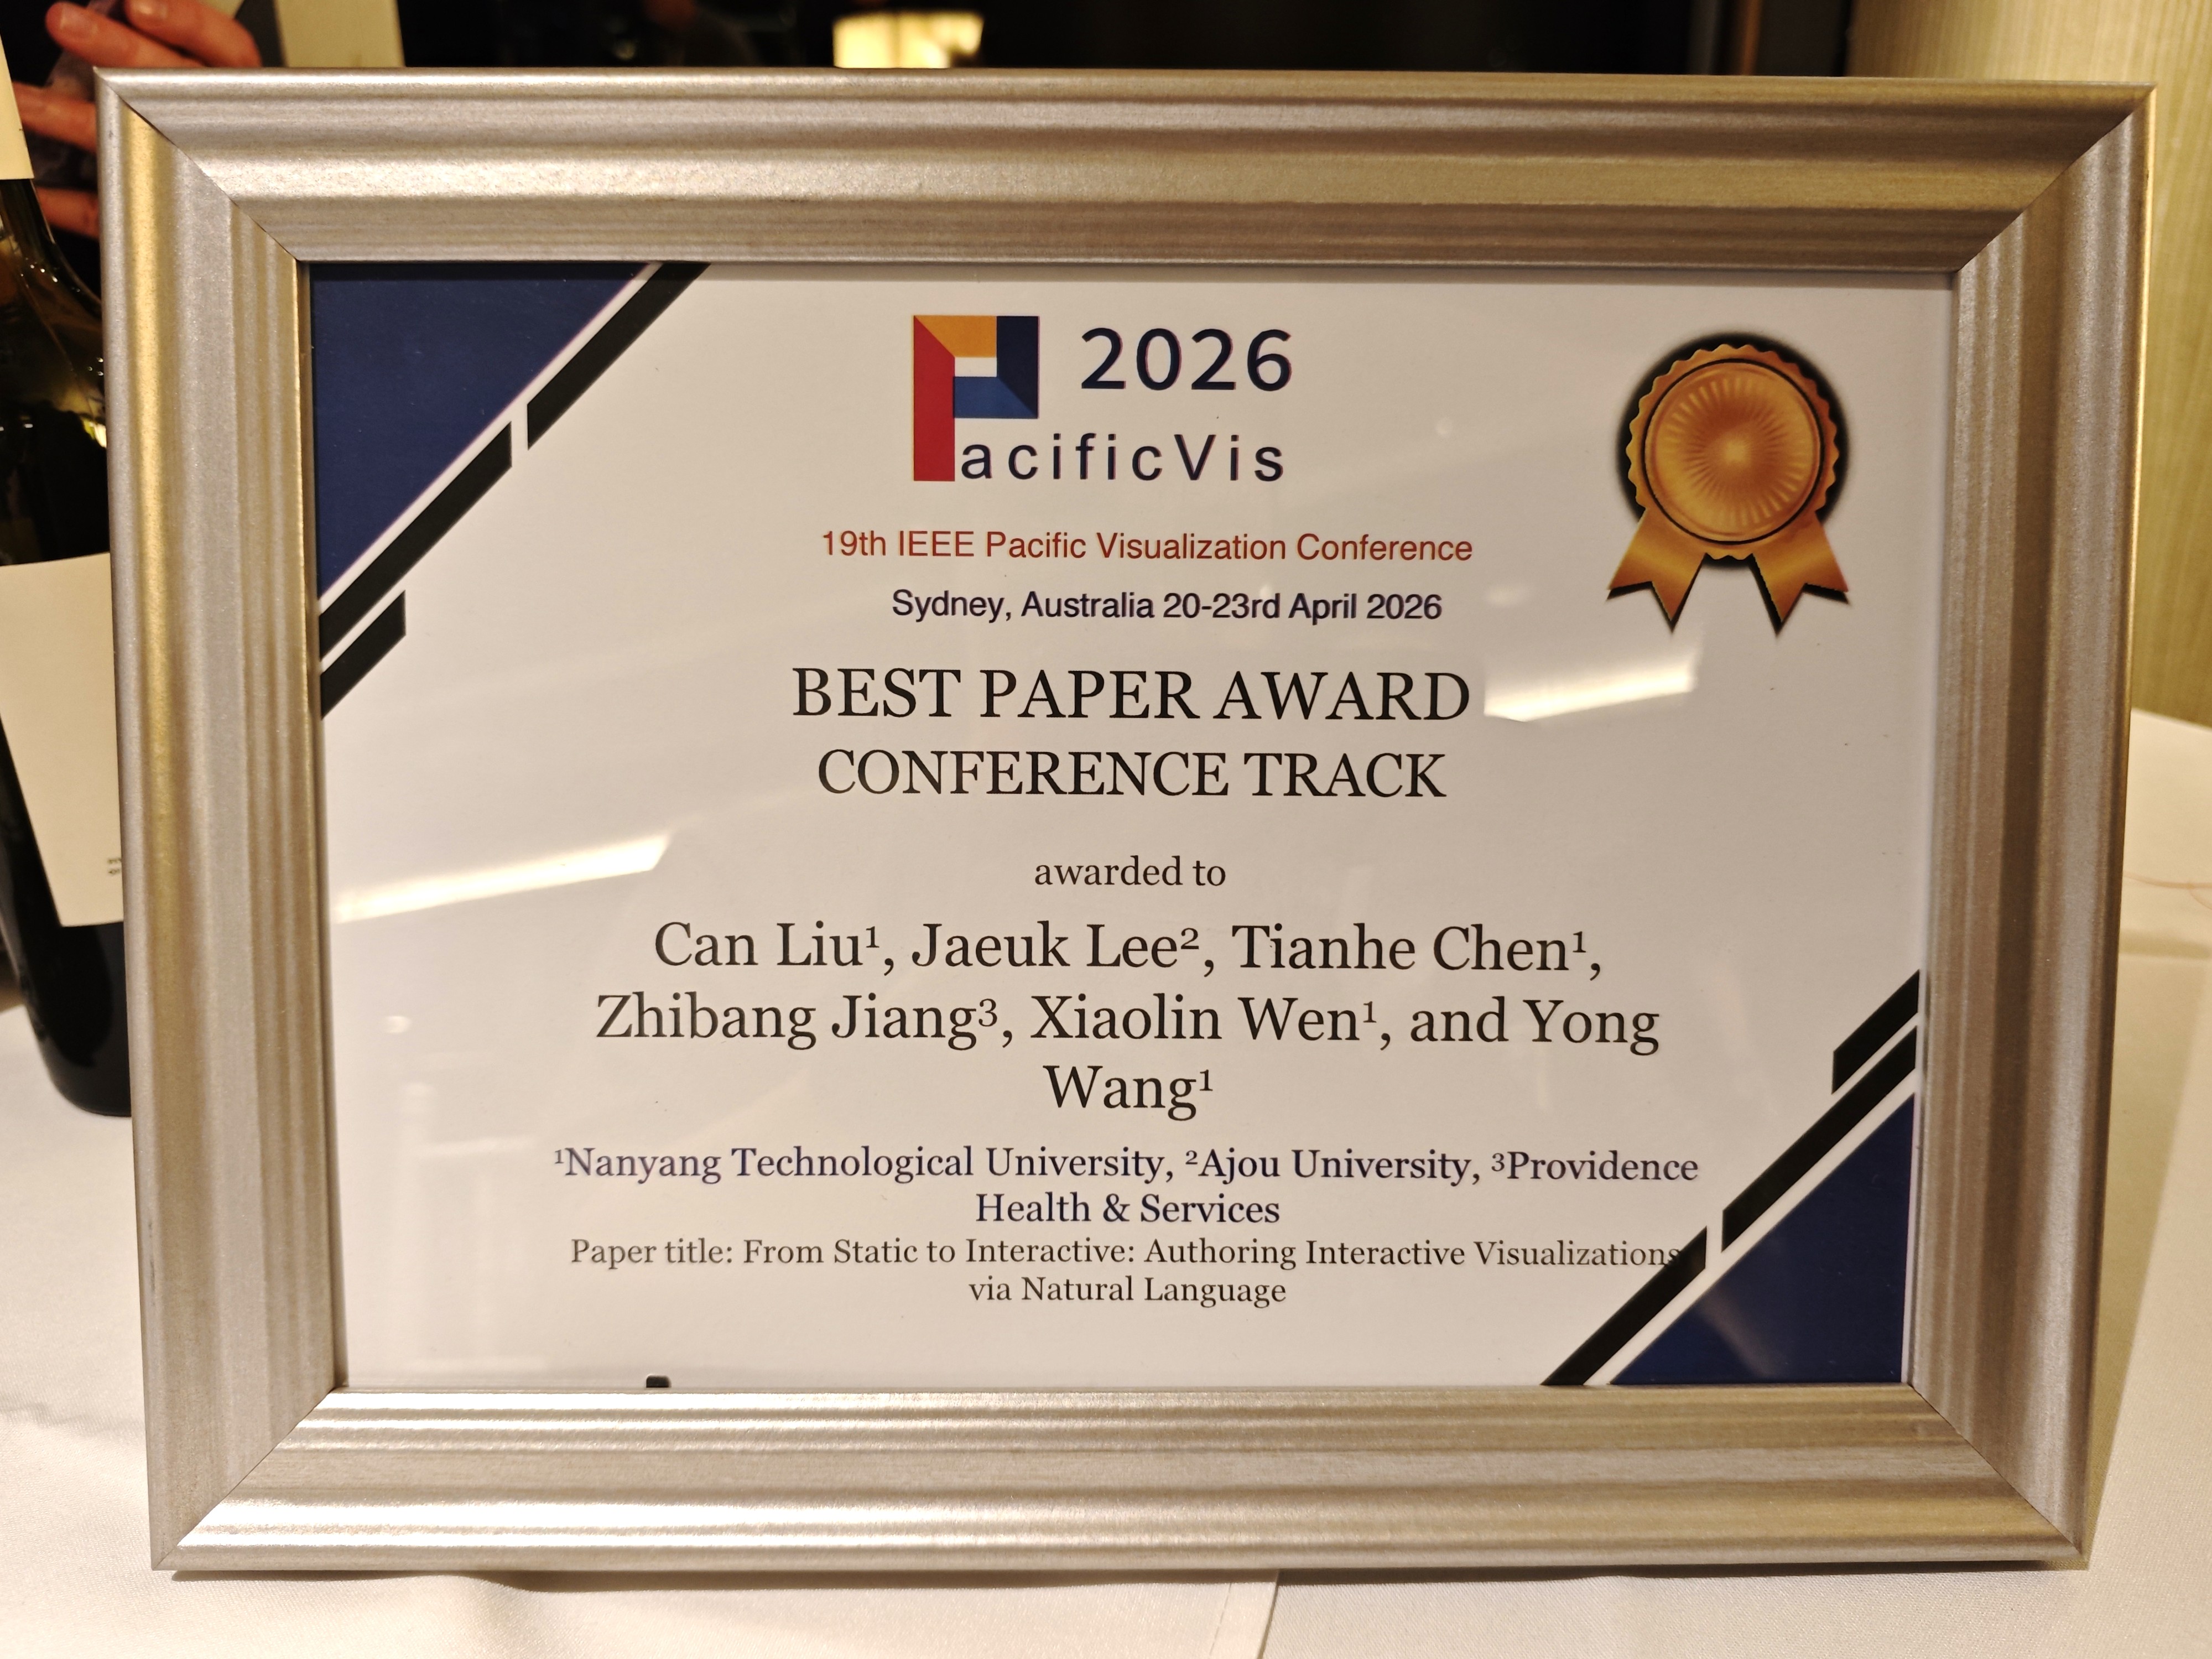
The approach, detailed in the paper "From Static to Interactive: Authoring Interactive Visualizations via Natural Language," earned the team the Best Paper Award at IEEE PacificVis 2026 in Sydney, Australia, one of the leading conferences on data visualisation in the Asia-Pacific region.
A new dimension to interactive visualisations
What makes Athanor different from existing data visualisation tools such as D3, Vega-Lite, or ECharts is the ability to static charts into flexible, interactive representations using natural language alone. The system introduces three technical innovations: an action-modification interaction design space that maps what users want to do to specific visual adjustments; a multi-agent requirement analyser that translates natural language instructions into actionable operations; and a visualisation abstraction transformer that converts static charts into flexible, interactive representations.
This means the user can upload a static chart from a report or publication and request interactions such as tooltips, filtering, zooming, comparison views, or chart transformations. Athanor automatically generates these interactive capabilities, allowing users to explore the data more deeply without access to the original code or dataset.
It effectively turns "make this chart interactive" from a programming task into a natural language command that helps users engage better with data to support decision making.
The potential applications are wide-ranging, from education and public policy to business reporting, anywhere static charts currently limit how people can engage with data. This allows a much wider range of users to explore, analyse and extract insights from data, without needing specialised programming expertise.
This work reflects CCDS's commitment to research that moves beyond theory into practical solutions, developing AI tools that make information more accessible, usable, and open to everyone.
Other contributors to the paper include Research Fellow Dr Can Liu, Tianhe Chen and Xiaolin Wen from CCDS; Jaeuk Lee from Ajou University; and Zhibang Jiang from Providence Health & Services. Read it here: https://arxiv.org/abs/2601.17736.